
Infographics are important for any company; it’s a simple method of explaining a complicated issue in a visual manner instead of in paragraphs of words. If for instance you wanted to explain buying trends to a client, you would use Infographics to portray this. Think of it in terms of a graph which is much easier to understand, visual and more pleasing to the eye. But how are Infographics created? Well there are tools out there to help you, and it’s a much more simple process than you think. Below is a list of the top 10 infographic creating tools to assist you.
Piktochart:
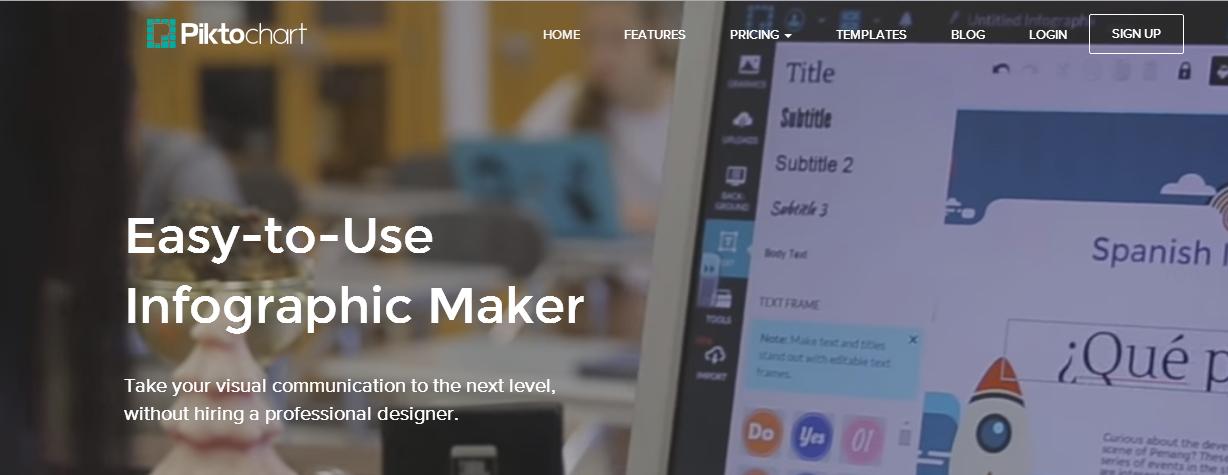
Piktochart tool creates simple visuals, it uses a simple user friendly experience on the web where you can drag and drop different images and also shapes. You can create pie charts, and also print off anything that you have saved to PNG or JPG format. It is worth noting though that a small watermark will appear on all of the downloads.
Easel.ly:
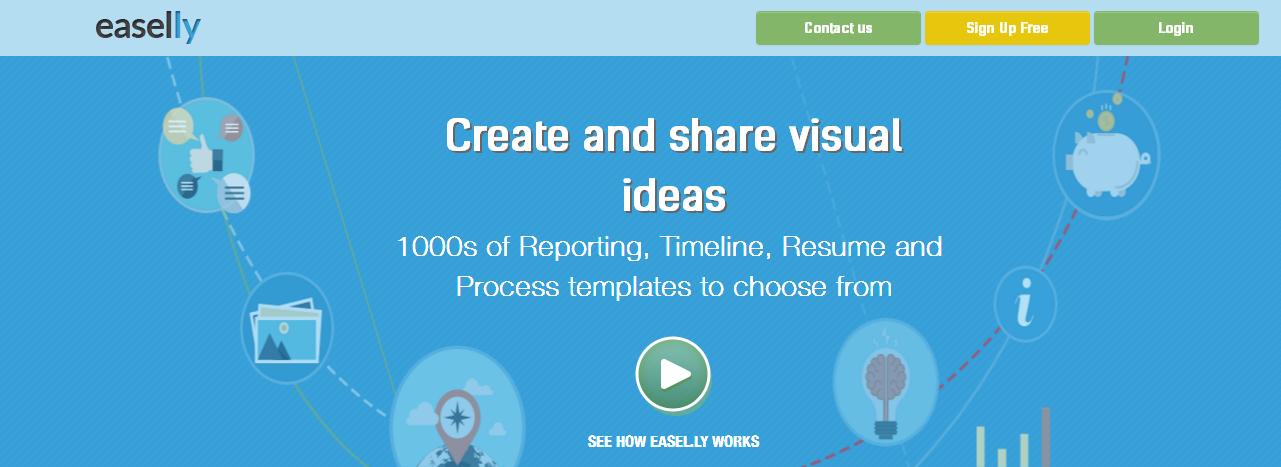
Another free web tool that features in our list is this one; Easel.ly is fantastic for storytelling as well as visuals. It’s no big deal that you can’t create graphs with this, once you see the objects and backgrounds you can use like people and animals. You can also upload your own images, and then download what you create in JPEG format.
Info.gram:

Look at this Info.gram ,if you wanted to create charts using the data that you have available, in either a bar chart, scatter chart or even a cool bubble graph then look no further! As well as this you can add you own video and images, it can be embedded in your website also if you choose.
Tableau:

To create Infographics by installing some software rather than creating it online, then you could try this Tableau windows based data visualization program. All you need to do is upload a spreadsheet or CSV format file to create interactive visuals, for example something like a heat map.
Omnigraffle:
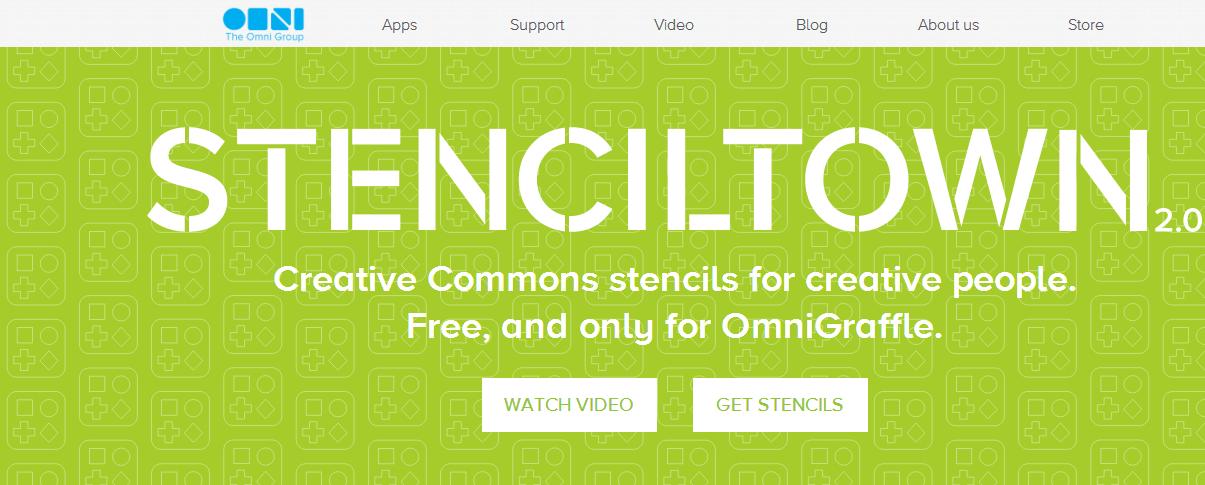
Although you do have to pay for this desktop application for creating Infographics, it does have free downloadable stencils. Omnigraffle is a very effective tool for wire framing too; it’s just a shame that at the moment it is only available for the Mac operating system.
Bulsamiq:
Another good tool is Bulsamiq that will create simple diagrams, which are sufficient for mobile and web internet use, is the desktop version of this program. But before deciding you could always try the free web demo that is featured, although the desktop version will allow you to import images from your computer. And you can also edit and link between multiple mockups.
Visual.ly:
Check visual.ly if you actually need someone who specializes in the field of Infographics then this could be the place to find it, it’s a marketplace where motion graphic artists and visual designers come together to connect with you. They will share their ideas, and you can also download free tools which work alongside data from Twitter and Facebook. One example is visuals that actually analyze hashtags.
RSA Animate Series:
RSA animate series is one if you wanted to convey a message or a new concept to a client then this is the ideal way to do it, it uses visual communication to pitch your ideas. You can hire an illustration artist or even do the drawing yourself on a whiteboard, so the client can hear your explanation as well as see it in visual.
TimelineJs:
Timeline JS is a tool that links to other websites such as YouTube and twitter to create timelines; this is handy for your webpage in telling a story instead of just typing dates. So if you want to create a timeline to explain how and when your company started, then use this tool.
Present.me:
Present.me is the right one if you can’t make an important meeting or appointment or the client is delayed, then you can present to them via video with this tool. It shows on one side in visual your presentation, and seated right next to that is a video of yourself explaining or pitching. This is also ideal for a blog to explain or narrate a story, use this on your own website to show to your friends. It works well on a personal level as well as a business level.
Whichever tool you decide to choose for your Infographics or visual and voice communication, they will all help you and your business. So check it out, and see what you can create that is visually appealing.


